StratNavApp.com banner ad

How to design a Target Operating Model (TOM)

Once you've articulated your strategy, one of the next things to do is to design the organisation to deliver it. This is usually expressed in the form of a Target Operating Model (TOM). A TOM may be for a new organisation you're going to set up, or it may describe the end state for a change programme for an existing organisation.

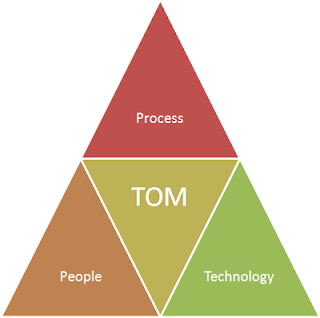
Triangle show components of the TOM

The general approach is to define the people, processes and technology required to deliver the strategy.

Process

The most common approach for identifying an organisation's processes for creating value is to use Value Chain methodology popularised by Michael Porter. This allows you to identify both

  • the core processes, such as manufacturing, sales and distribution, and
  • the supporting functions, such finance, IT and HR.

Both types of processes may be essential to the delivery of your strategy.

For each process, it is important to understand

  1. what the critical success factors (KSFs) and key performance indicators (KPIs) are. That is, what does 'good' look like in the performance of the process.
  2. what the inputs are and who provides them.
  3. what the outputs are and who receives or consumes them.
  4. the type of process: for example, you can classify processes as
    • unit or job processes: units of work are processed one at a time from start to finish, like building houses or tailoring suits.
    • batch processes: a defined number of units are processed together, like off-the-rack clothing, 
    • mass production processes: units of work move in sequence through stages, like assembling automobiles, or 
    • continuous processes: output is continuous, like paper milling.
  5. anticipated volume and frequency of performance, and drivers of both.
  6. whether and how the process is required to be performed in a differentiated manner in order to deliver strategic value.

Once you've identified and defined your processes, it should follow naturally what people and technology the processes will need.

People

For each process, identify:

  • the roles, 
  • numbers of people in each role, and 
  • skills, capabilities and knowledge required by each role.

Consider also whether you will need to:

  • hire in new or additional people, 
  • provide more training to existing people, or 
  • partner with organisations who already have the types of people you need.

You're then in a position to consider:

  • reporting lines,
  • organisational design,
  • governance and 
  • rewards (including compensation and benefits).

Don't forget to think about where the people are or will be physically located, and what implications that might have for your organisation.

Finally, consider the impact of organisational values and culture.

See also:

Technology

Technology and systems enable the people to perform the processes.

These include computer systems, manual systems, manufacturing systems and any other supporting technologies.

Do these systems and technologies exist or can you buy, license or rent them? Can you use 'off-the-shelf' systems, or will you have to develop bespoke solutions especially for your business? The more differentiated your processes are the more likely it is that you will need bespoke solutions, or that pre-existing solutions will need extensive customisation.

How will you integrate and maintain these systems? You should be able to map this back to your process view.

Extended approaches

There are a number of different ways in which you could extend this general people-process-technology approach.

Firstly, you could go beyond the convention of considering just people and technology. For example, you could consider all 7 dimensions encapsulated in the McKinsey 7S analysis. People or Staff and technology or Systems are two of the 7 Ses. McKinsey 7S does not emphasise the process dimension.

Secondly, you could adopt the POLISM model developed by Andrew Campbell, and others, at Ashridge Business School. POLISM stands for Process (or value chain), Organisation, Locations, Information Structure and Management system. This gives more prominence to location and suppliers. It considers information and management systems more explicitly than it does technology.

Andrew then went on to propose an integration of the POLISM model and the Business Model Canvas. I have previously written about this in Introducing the Enhanced Business Model Canvas.

The Target Operating Model's role in business strategy execution

Your strategy implementation plan needs to consider all of the implications of the above:

  • designing processes,
  • hiring, training and motivating staff,
  • acquiring or building up knowledge, and
  • selecting, implementing, customising, building and/or integrating systems.

Designing a TOM is a significant piece of work. But, the real challenge lies in developing and implementing a TOM which actually

  1. delivers your strategy and
  2. differentiates your organisation from the competition.

StratNavApp.com is the online collaborative tool for strategy development and execution. It integrates all of the tools mentioned above: Porter's Value Chain, including Process, People and Technology,  McKinsey 7S, and the Enhanced Business Model Canvas. So it can help you develop your Target Operating Model. It is free to use, so go ahead and give it a try.

Skyfall moments in business

There is a moment in the new James Bond film, Skyfall, when 007 realises that he is the victim of someone else's plan. Its an uncomfortable feeling for him, as he feels he is always trying to catch up and never in control.

Many firms find themselves in a similar position, where markets become dictated by larger competitors, suppliers, customer and regulators. It is what you do in such circumstances which makes all the differences. Many first simply redouble their efforts to catch up and get ahead of the competition. Most find that this is an expensive exercise by no means guaranteed to succeed.

James Bond did not do that. Instead, he withdrew from the field, fell back on his own strengths and sought out competitive environment he knew better than anyone else. Then he forced the competition to come to him, in his territory, and on his terms.

And that is the secret to success. Whether you call it competitive differentiation, relative competitive advantage, or Blue Ocean Strategy, companies that succeed do so by relying on their own strengths and picking their own competitive arenas, and not by competing on other people's terms.

Analyse the business and its environment

The world is full of strategy analysis tools, models and frameworks, many of which  are very useful for getting to grips with  the strategic challenges the organisation faces. See 7 essential strategy analysis tools for examples of some of the most popular and useful ones.

However, it is important to remember that all of these models are a means to an end, and not an end in themselves. The 'end' is to generate strategic insight which is useful in generating successful strategy. The strategy analysis frameworks and models may help you to do this, but strategic insights generated without the aid of such frameworks and models can be just as good as those generated with them.

Analysis generally requires data as an input. In strategy, data usually arrives from one of four sources:

  1. data which is generated within your business, such as operational performance data.
  2. data which is generated in the interaction of your business with the outside world, such as from customer or supplier transactions.
  3. data which is generated by primary research, such as customer surveys and focus groups you conduct.
  4. data originating from secondary research, such as industry wide reports.

Whatever the source of the data, the basic process of analysis is the same.

  1. First the data is studied to see if there are any trends: for example 10 daily sales volumes, each higher than the preceding one, shows an increasing trend in sales data
  2. Then the trends are studied to see if they yield any patterns: for example, sales always increase when the weather gets warmer.
  3. Then we attempt to deduce the structures supporting those patterns: customers buy more ice-cream when it is warmer.
  4. And finally we attempt to derive theories explaining what we see: customer buy ice-cream when they are hot because it cools them down.

It is those theories that drive insight. (For example, if we can sell both ice-cream and hot chocolate, our stores will be busy whether the weather is hot or cold. Or, ice-creams compete with soft drinks, not just with other ice-creams.)

As humans we are conditioned to this process and do it so naturally that we don't always notice we're doing it. Unfortunately, we are also fallible and can jump to conclusions without properly considering all of the data. The 'scientific method' is useful in this context. By actively seeking out to disprove our theories, we increase our confidence that the ones we can't disprove may actually be correct.

Analysis is an art as much as it is a science. Some people seem to have a knack for looking at data in different ways which more effectively unlock its secrets.

There are also people who think intuition trumps analysis. They argue that analysis is cold and clinical and doesn't always take into account the whole picture and the subtle clues. I am less convinced. I think that intuition is a form of analysis - its just analysis of the experience data that resides in our brains rather than coded on spreadsheets and in databases.

Big data is having a profound effect on the art of strategic analysis. With more and more data about wider and wider ranges and types of human behaviours increasingly available in computer systems, our ability to derive strategic insight from coded data is better than ever before. See, for example, More data usually beats better algorithms. Of course, the availability of this data increases rather than reduces the burden of analysing it for insight.

Control Processes in the Strategic Learning Cycle

Once you've articulated your strategic vision, objectives and values, and crafted your implementation plan of action, the fourth phase in the Strategic Learning Cycle is to control your execution.

The strategic control framework usually consists of 4 components:
  • Measurement: the first level of control is to measure whether you are achieving your strategic objectives - see How to measure success against strategic vision and objectives . Measurement also provides the data on which the other 3 components depend.
  • Risks and Issues Management: your measurement system should help you to monitor the risks to your strategy and identify any issues as early as is possible.
  • Feedback: identified issues provide feedback. The Strategic Learning Cycle provides 2 feedback loops. The first loop returns to planning and implementation - plans are adjusted and efforts are redoubled, but the strategy itself remains unchanged. The second feedback loop returns to analysis - if the conditions on which the original analysis was based are found to not have been true or to have changed, then reworking the analysis may lead you to change the strategy itself.
  • Governance: finally it is important to have a good governance framework in place. This ensures that the right information reaches the right people at the right time, and empowers those people to use it to make decisions in a suitably transparent manner. (By contrast, poor governance suppresses or obscures information and allows decisions to be made based on special interests.)

An analogy for the power of focus

I heard a great analogy for the power of 'focus' yesterday. It went like this:
If I throw ten balls at you, you probably won't catch any of them. If I throw one ball at you, you'll probably catch it.

What goes viral?

At the time of writing, this video had been watched 483 million times on YouTube, and spawned countless spinoffs and a dance craze. It has been covered by CNN, and the artist has appeared at the MTV music awards, and on NBC's morning talk shows.

I'll leave you to decide on the artistic merits of the video for yourself, but if there was ever proof of both (a) that what goes viral and what does not is as much down to circumstance as it is to anything else, and (b) the power of social networks to shape and channel popular opinion, then this must surely be it!

UPDATE December 2012: Unfortunately, You Tube seems to have disable embedding of this video so you will have to click through on this link to watch the Gangnam Style video. It has now been watched over 930m times.

See also: The difference between Viral Marketing and Viral Business Models

As an interesting addendum, there has been a discussion on Quora about how much it cost YouTube to stream a video like this: The top voted answer suggests that by 23 October 2012 at which time it had been watched 530 million times, it would have cost YouTube about £300k, but that they would have earned about £350k from advertising revenues off the back of it.

Update March 2013: Since writing the post above, I came across this TED Talk by Kevin Allocca of YouTube on why videos go viral. He ascribes it to three reasons (1) tastemakers: those famous people we look to for fashion and taste, (2) communities of participation: people who adopt the meme create spinoffs, and (3) unexpectedness. Watch the TED Talk below:

How to do a PESTEL analysis

Image of PESTEL Analysis
PESTEL Analysis

Contents

What is a PESTEL analysis?

PESTEL analysis is a business strategy framework which is used to identify, categorise and analyse the key external threats and opportunities a firm faces now and into the future. 

The six letters in PESTEL represent the 6 most common categories used: P for Political, E for Economic, S for Social (or Socio-Economic), T for Technological, E for Environmental and L for Legal.

It is often termed a macro-scanning tool. This is because it involves looking a the big-picture long-term changes in the external environment. (The external environment is also sometimes called the macro-environment.)

A PESTEL analysis is a key input to most strategy development and execution processes.

Why should you do a PESTEL analysis?

The PESTEL analysis is an essential strategy analysis tool for any strategist's toolkit.

Together with other tools such as Porter's 5 Forces analysis it encourages firms to consider the external environment in which they operate. This is particularly important for more established, mature firms, which have a tendency toward bureaucracy and become inward-looking.

PESTEL analysis can also provide a more forward-looking perspective by flushing out trends. This can provide advance warning of potential threats and opportunities, giving the firm more time to react. The different possible outcomes from these trends can then also be combined and developed into scenarios.

PESTEL analysis is particularly powerful when used:

What goes in each of the 6 categories on a PESTEL analysis?

Different factors will be more or less important to different businesses or industries. The descriptions below attempt to be as broad and comprehensive as possible so that you can choose what you think is relevant to your situation.

Political

The Political sector includes any government, parastatal and special interest group actions or lobbying in the form of policy, legislation, taxes and duties. It also considers the stability or instability of governments. It is important to understand the political agenda and how it might move for or against certain industries or practices.

This might include:

  • 'positive' moves such as the subsidies offered for alternative green energy production, or
  • 'negative' moves such as increasing taxes on alcohol or tobacco.

Depending on your firm, it may be important to consider both domestic policy as well as international policy, trade policy and pressure groups.

Quick checklist

  • Government policy
  • Legislation
  • Political harmony/conflict and stability/instability
  • Elections and coalitions
  • Foreign trade policy, restrictions and agreements
  • Tax policy
  • Labour policy
  • Forthcoming elections and election cycles
  • Government stability
  • Lobbying activity and protests
  • Defence policy and spending
  • Terrorism, war and other military considerations
  • Environmental policy
  • Funding grants and initiatives
  • Subsidies and tariffs
  • Fiscal policy
  • Freedom of speech and the press
  • Government bureaucracy

(See, for example, Three different regulatory responses and their impact on industry.)

Questions to ask:

  • Is the political environment stable? If not, how might it change?
  • What government policies or political groups could be beneficial or detrimental to the firm's success?

Economic

The Economic sector includes the general economic environment and the effects that this might have on the business and its customers, distributors and suppliers.

In conducting your analysis, it is important to distinguish between

  • long-term trends and structural issues, and
  • seasonal or cyclical issues.

Quick checklist

  • Economic growth (e.g. GDP)
  • Interest rates
  • Exchange rates
  • Inflation
  • Disposable income of consumers and businesses
  • Savings and investment rates/propensity to spend
  • Taxation
  • Wages (both absolute levels and growth rates)
  • Employment/unemployment rates
  • Financial markets
  • Property prices
  • Commodity and raw materials prices
  • Availability of finance/credit
  • Supply and demand factors
  • Cycles and bubbles

These might operate in aggregate or on a sector-specific basis.

Internationally, you might also consider:

  • import/export conditions,
  • foreign exchange conditions, and
  • trade deficits/surpluses.

Questions to ask:

  • How, specifically, do each of the different economic factors impact the firm's business?
  • What factors could cause an improvement or deterioration in each of the different economic factors?

Social

The Social sector considers changes in social preferences and norms. This is sometimes also called the Socio-Economic or Socio-Cultural sector.

Quick checklist

  • Demographics, including
    • Population growth
    • Population age distribution
    • Birth and death rates
  • Family size and dynamics
    • Marriage, divorce and cohabitation
  • Living standards
  • Wealth distribution
  • Ethnic and religious view and norms
  • Health and health consciousness
  • Education standards
  • Career choices and attitudes
  • Work patterns and preferences, including attitudes towards
    • retirement
    • flexibility
  • Customer preferences and buying trends
  • Leisure activities and lifestyles
  • Cultural trends
  • Fashion trends and fads
  • Industrial reviews and consumer confidence
  • Organisational image
  • Attitudes towards the government, business and equality/diversity (race, gender, ability, foreigners/immigrants, minorities, etc.)
  • Crime

Questions to ask:

  • How do our customers' circumstances and attitudes affect their buying habits?
  • How are our customers' and other stakeholders' circumstances and attitudes changing?

Technological

The Technological sector considers the impact of all forms of technological development and innovation.

This could include

  • new ways of producing goods and services
  • new ways of distributing goods and services, and
  • new ways of communicating with and engaging customers, suppliers and distributors.

The development of information technologies, including the internet and associated technologies such as mobile access is obviously a major factor here. This includes both the consumer and business-to-business applications of this. But it also includes improvements in manufacturing processes, materials, energy and transportation.

Quick checklist

  • Research and development capability and pipelines,
  • Producing goods and services
  • Distributing goods and services
  • Communications infrastructure
  • Digital and mobile technologies
  • Automation
  • The Internet of Things (IoT)
  • Emerging technologies
  • Technological lifecycle: including maturity and obsolescence
  • Target market communication
  • Copyright or patent protection for intellectual property ("IP"), and their efficacy
  • Increased training required to use new technologies
  • Potential return on investment from new technologies
  • Technological awareness and proficiency

Questions to ask:

  • What innovations and technological innovations are available or on the horizon?
  • How might they affect the firm?

Environmental

The Environmental sector has become increasingly important in recent years as stakeholders have become more conscious of humankind's impact on the natural environment.

Consider:

  • changes and opportunities throughout the value chain which could impact the environment, including,
  • opportunities to communicate what the organisation is doing about them more effectively, and
  • Corporate Social Responsibility (CSR) where businesses contribute to societal goals either through how they operate and/or through philanthropic activities such as volunteering or charitable donations/activities.

Quick checklist

  • The availability of raw materials
  • Pollution and greenhouse gas emissions
  • Positive business ethics and sustainability
  • Carbon footprint
  • Climate and weather
  • Natural disasters
  • Renewable energy, waste management and recycling
  • Environmental legislation
  • Geographic location and accessibility

Questions to ask:

  • How is the physical environment changing and how will this impact the business?
  • How are attitudes towards the business's impact on the physical environment changing>

Legal

Finally, the Legal sector looks at changes in laws, lawsuits and regulations which affect the business. These can be general changes in the industry, or specific lawsuits or regulatory interventions or sanctions which the business is facing.

Quick checklist

  • Health and safety regulations
  • Equal opportunities laws
  • Advertising standards rules
  • Consumer rights and protections
  • Privacy and data protection laws
  • Product labelling requirements
  • Product safety requirements
  • Safety standards
  • Employment/labour laws
  • Anti-trust and competition laws
  • Copyright, patent, intellectual laws
  • Licenses and permits

Note that there is often a high cross-over between political and legal factors. However, while political policies may create certain advantages and disadvantages, legal factors must be complied with.

Questions to ask:

  • What laws and regulations apply to the business across all of the markets in which it operates and how do they help or hinder the business?
  • How might these laws and regulations change?

What are some variations of PESTEL analysis?

There are several variations of the traditional PESTEL analysis. These include:

  • PESTLE analysis: a simple re-ordering of the last two letters/categories.
  • PESTLIED analysis: includes additional letters/categories for International and Demographic.
  • STEEPLE analysis: includes a third E for Ethical.
  • STEEPLED analysis: like STEEPLE but also including a D for Demographic.
  • SLEPT analysis: a simple re-ordering of the letters/categories, with the Environmental category removed.
  • STEPE analysis: a simple re-ordering of the letters/categories, with the Legal category removed.
  • PEST analysis: a simplification without the last two letters/categories for Environmetal and Legal.
  • STEP analysis: PEST in a different order.
  • LONGPEST / LONGPESTEL: LOcal, National and Global factors plus PEST or PESTEL.

In addition, the L is sometimes taken to mean Labour, rather than Legal.

The existence of all of these variations drives home the fact that it does not really matter which words and letters you use as long as you have a systematic review of the competitive environment.

How to do a PESTEL analysis

There are a number of steps you can take:

  1. Brainstorm: get a cross-section of people together from different areas and functions with the business to brainstorm some initial ideas.
    • Use the suggestions and questions outlined above for each section as input to your brainstorm.
    • Brainstorm not just what is happening or could happen, but also what the positive and/or negative impact on the business could be.
  2. Consult: seek the opinions of experts from outside your business.
    • These could be customers, distributors, suppliers, consultants, academics or any other experts.
  3. Research: gather evidence for each insight in your PESTEL analysis.
    • It is important to not only look for evidence which supports the insight, but also to gather any evidence which might contradict it. Few things in a PESTEL analysis are guaranteed cut and dried.
  4. Evaluate: score each of the items on your PESTEL analysis for:
    • likelihood: if it is not already happening, how likely is it to happen.
    • impact: how big an impact could it have on the business.
    • You can let all members of a team score each insight individually, and then debate until the scores start to converge.
  5. Refine: repeat the process until you have narrowed it down to a manageable number of clearly articulated and insightful points in each of the 6 categories.

How to do PESTEL analysis well

PESTEL analysis, like SWOT analysis is frequently criticised. Usually, this is usually on the basis of an analysis that has been done poorly. For example, PESTEL analysis often degenerates into long lists of 'things' without context, relevance or evidence. Don't fall into that trap. If you do, most of the time you spend doing PESTEL analysis will be wasted.

As you work through each quadrant, it is important to identify and document:

  • What is happening or could happen?
  • What is or could be the impact on your firm/division/department? (That is, be sure to answer the proverbial "So what?" question.)
  • What evidence you have to support this assessment?

A good way to express something on a PESTEL would be along the lines of:

X could/will/is caus(e/ing)/lead(ing) to Y (which leads to Z)
with evidence provided in supporting paragraphs and charts. 

Depending on how thorough you are being, you could also try to quantify the likelihood and impact of various levels of change happening, and the time frames over which they might happen.

Finally, you should consider the environmental signals you intend to monitor to stay abreast of any changes, or the actions you might take to influence the outcomes (such as joining an industry or policy group and or lobbying for changes).

Avoid the temptation to make decisions based on individual insights from your PESTEL analysis. Instead, base decisions on the balance of evidence across the whole of the PESTEL analysis and within the context of all of your other strategic analysis and priorities.

Where can I get a PESTEL analysis template?

You can easily create a simple PESTEL analysis template in common programmes like Microsoft Word, PowerPoint or Excel using a simple table structure.

Alternative, you can build a PESTEL analysis, alone or with a team, using a tool like StratNavApp.com. StratNavApp.com is the online collaborative tool for business strategy development and execution.

Using a purpose-built tool like StratNavApp.com has a number of advantages. For example, StratNavApp.com will:

  • Keep track of which users made which changes to your PESTEL analysis, and when.
  • Help you collect and link evidence in support of each insight on your PESTEL analysis.
  • Link insights from your PESTEL analysis to other appropriate areas of your business strategy.
  • Free accounts are available, it works on all devices and no other software (other than a browser) is required.

Examples of PESTEL Analysis

Here are some examples of PESTEL Analyses.

How often should you do a PESTEL Analysis?

It depends on how quickly your industry and competitive environment changes. These days, the pace of change for most businesses is quick rapid. So you should probably review your PESTEL analysis at least every 6 months.

A better approach, however, is to monitor the environment on a continual basis. Nominate specific people in your business to keep an eye on different sectors in your PESTEL analysis. Choose people who have natural if not professional interest in that subject. Ensure those people are reading the relevant journals, and talking to your suppliers, distributors, customers and other stakeholders about their allocated sector on an ongoing basis. Charge them to keep the analysis up to date and alert the rest of your team if there are any material changes in their sector.

A tool like StratNavApp.com will make this easier to do.

See also:

Strategy by the Numbers

The numbers suggest that organisations are just not that good at strategy.


This is my first attempt at putting something up on Slideshare. Please let me know what you think. 

And, of course, if you need some help avoiding these pitfalls, feel free to drop me a line.

Strategy by the numbers is now also available as an infographic.


STRATEGY as an acronym

I chanced across a curious little discussion on LinkedIn today where a few people were suggesting what STRATEGY could stand for as an acronym.

Here is a sample of the results in table form for convenience:

S
T
R
A T E G Y
Specific (ability to communicate) Thoughtful (there is nothing common about common sense) Reasonable (in the circumstances) Appropriate (bearing in mind what others are doing) Timely (why this, why now?) Explicable (understanding of process and interrelationships) Goal Orientated (the link between means and ends) Yields Results (value creation)
Systematically Target Results Anticipate Trends Execute Generate Yield
Serious (not bouncing ideas around) Thorough (every angle considered) Responsive (to the environment in which strategy is being formed.) Active (ready to move on ,not passive) Task oriented (Keeping the mission in mind rather than nebulous thinking) Explorative Goal directed Yielding flexibility (not stuck in old patterns)
Scalability Team oriented Realistic Actionable Time line Emotional Goal oriented Yearned Goal

This is a fascinating little exercise in its own right, but it struck me that asking people to reverse engineer an acronym out of a word was an interesting way to get behind the scenes and understand what they thought it really meant. Presumably they'd be so busy thinking about clever acronym tricks that they'd inadvertently let their true hidden meanings out. One might for example, speculate that someone who said strategy must be serious, has experienced something of the opposite. The use of such an emotive word as "yearning" is also interesting when juxtaposed against all the other more dispassionate words.

This reminds me a little bit of the Zaltman Metaphor Elicitation Technique.

Have your tried this or a similar technique? How did it work out for you?

Strategy Canvas: What is it and how to complete one in 4 easy steps

The Strategy Canvas was popularised by W. Chan Kim and Renée Mauborgne in their popular book "Blue Ocean Strategy: How To Create Uncontested Market Space And Make The Competition Irrelevant".

Strategy Canvases provide a simple way of visualising how your competitors attract customers, and/or how your customers choose the product or service they buy in your category. This allows you to differentiate yourself by choosing a different combination of factors on which to compete.

In very simple terms, for example, if all of your competitors compete on price, you might choose to compete not on price but on quality, by launching a premium brand. In practice, of course, the situation is seldom that simple, and you'll be looking for a unique combination of factors, rather than a single factor alone. And it is here that the Strategy Canvas's visualisation method comes into its own.

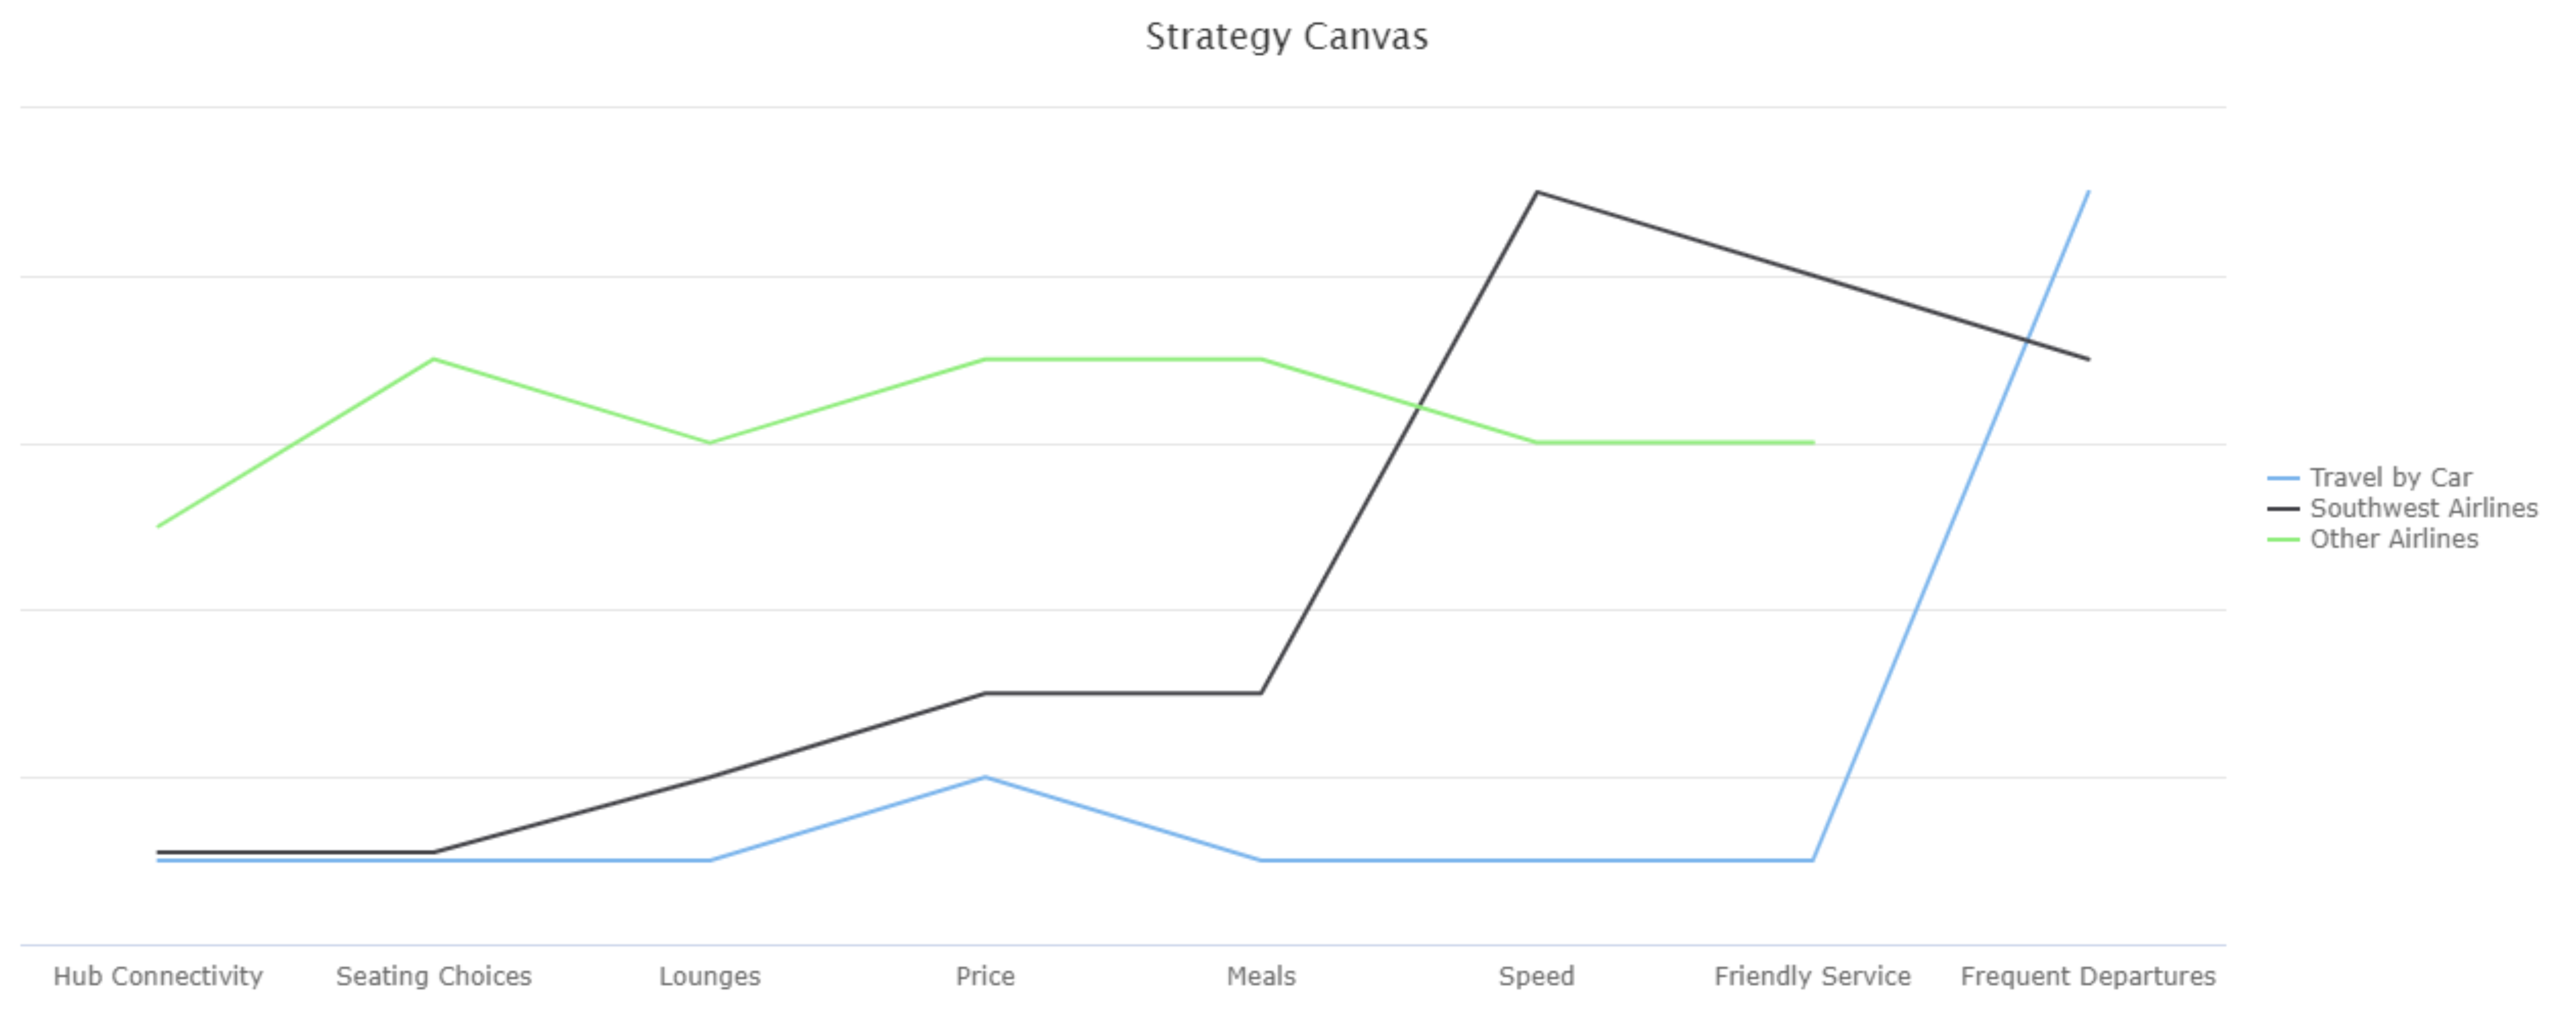
The diagram below shows an example of a Strategy Canvas for Southwest Airlines (based on an analysis from "Blue Ocean Strategy"). It shows how Southwest Airline carved out its strategic differentiation by combining the no-frills, no-hassle convenience and cost of travelling by car with the speed and friendly service of an airline. In fact by removing the airlines' add-ons, Southwest was able to improve on the service and speed they offered. There are many case studies on Southwest Airlines which you can read so I won't go into further details here.


Strategy Canvas for Southwest Airlines

The Strategy Map shown above was drawn with StratNavApp.com, the online collaborative tool for strategists. It's free to use, so why not give it a go?

There are 4 relatively simple steps to preparing your own Strategy Canvas.

1. Identify the competition

The first step to drawing a Strategy Canvas is to know who your competition is. In fact, this is essential to any strategic thinking process. Depending on the nature of your industry, you could identify individual competitors by name, or, as in the example above, you might find it easier to cluster them into a smaller number of semi-homogeneous groups. Don't forget to include your own business, whether you are in the market yet or not.

When identifying competitors, it is always important to look at the problem from the customer's perspective - who or what else could satisfy your customer needs? Had Southwest Airlines not done this, they would simply have listed the other airlines, and not realised that, in many cases, customers are choosing between flying and other modes of transport. It is unlikely they would have had the insight that led to their very successful strategy if they had not taken this broader view.

2. Identify the factors of competition

The second step is to identify the factors that your customers value when choosing the product or service you are offering. In the above example, these include the price, meals, lounges, seating choices, etc.

The simplest way to do this is to actually get out and speak to your target customers, but there are many research approaches you could adopt. Remember, it is important to speak to people who already buy your product and service, people who buy it but from your competitor, and people who don't yet buy your product and service but might in the future (especially if your strategy is successful). And don't forget that people don't always know what they want so you may need to get a little creative in order to find out.

3. Evaluate the competition

The third step is to draw the actual chart - draw a line for each competitor/type of competitor showing how well they perform in terms of each of the factors that your customers value.

It is often interesting to do steps 1 to 3 with a team in a closed room, just to see how different peoples strategy maps look in terms of the competitors/groups they select, the factors they consider important, and how they rate the competition. Strategy Canvases prepared on this basis can be significantly different, and the ensuing debate can be a valuable team building and strategising exercise if managed well.

However, once again, you can also ask your customers directly, just by talking to them or using a variety of research techniques, to get a more accurate and objective picture.

See also: 7 straight-forward steps to master competitor analysis

4. Chart your competitive differentiation

Now you are ready to map your new strategy onto the Canvas. The objective is to chart a line which is substantially different to the lines of any of your competitors/groups. That difference, that unique blend of competitive factors, is your competitive differentiation.

Think about:

  1. Which factors will you increase?

    For example, Southwest Airlines increased the frequency of departures.

  2. Which factors will you decrease?

    For example, Ikea reduced in-store service.

  3. Which factors will you eliminate?

    For example, Southwest Airlines eliminated inflight meals and seating choices.

  4. Which factors will you add?

    For example, Ikea added the ability to take furniture home from the store on the day you bought it, rather than ordering and then waiting for manufacture and delivery.

Of course, not just any differentiation will do. You must pick a combination that a sufficient number of your target customers will find compelling, in order to sustain your commercial objectives. You will undoubtedly have to dig deep into your box of other strategy tools to do so.

There is an art to drawing a really useful Strategy Canvas, but with a little practice, you can learn to draw really insightful diagrams. When you do, they are a great tool for communicating simple but powerful strategic ideas.

Why not share your own experiences with Strategy Canvases in the comments below?

See also:

On Design [Quotes]

"A designer knows he has achieved perfection not when there is nothing left to add, but when there is nothing left to take away."
Antoine de Saint-Exupéry Terre des Hommes (Man and His World)

"Design is not just what it looks like and feels like. Design is how it works." 
Steve Jobs 

"Almost all quality improvement comes via simplification of design, manufacturing... layout, processes, and procedures."
Tom Peters 

Money Mail launches five-point manifesto in bid to get Britain saving

I was heartened to read Money Mail's  five-point manifesto in bid to get Britain saving again.

With some exceptions, see below, I think it is a very sensible appeal.

For purposes of analysis, I've categorised their points slight differently:

1. Policy simplifications the government could make.

Money Mail rightly points out that the current ISA limits between cash and stocks and shares ISAs are confusing and simply get in the way. They should be removed and simplified. Likewise, preventing children with Child Trust Funds from taking out Junior ISAs is absurd. I can only imagine it was a sop to Child Trust Fund providers who did not want to make their products more competitive. I cannot see any real benefit to savers or to the industry. It is purely a question of public policy.

2. Things providers should be forced to do

I always think it is a pity when companies are forced to do things that their customers clearly want and would value. However, sometimes firms would be disadvantaged if they offered something to customers but none of their competitors did, and in those circumstances, some compulsion does not seem inappropriate. So regardless of how it is achieved, I think it would be great if all financial services companies provided friction free ISA transfers, better disclosure around past and future rates and charges (I am in favour of mandatory post-charge performance reporting), and enforced consideration of retirement income options. Similarly, whatever my misgivings about NEST/auto-enrollment, the rules prohibiting employers from encouraging opt-outs from auto-enrollment must be strictly enforced (although it is hard to imagine legislating a rule without that intention). Such changes would cost the industry very little in the short-term, would benefit customers enormously, and so, if applied uniformly across the entire industry, would be benefit the industry tremendously in the long term.

3. Simplifying interest rate structures

This is where I think I and the campaign part company. I don't think there should be any interference in the actual rates financial services firms pay savers. They should be able to pay different rates for different levels of service.

I would be particularly concerned if banks could not charge different rates according to the channel used. If online only banks could charge a rate reflecting that channel, but full service banks had to charge a single rate across all channels, for example, they would be at a distinct disadvantage. I accept that current practice may disadvantage the older and poorer savers, as the Money Mail campaign points out, but I believe we should look for solutions to this problem other than removing the rewards of innovation from the industry.

Likewise, I don't think banks should be forced to offer the same rates for ISAs as they do for other savings accounts, especially if they are forced to increase the level of service they must provide (see above). No, I think pricing and service levels should be made more transparent so that customers are able to make more informed choices, and then I think we should allow natural market forces to establish prices without intervention.

What do you think?

When did 'sales' become a dirty word?

It seems that 'sales' has become a dirty word in the UK financial services sector.

I am reminded of this as I read: Revealed: The bonus list that encourages 'pressure cooker' sales culture at Lloyds | This is Money.

The article says:

He has sent This is Money a document revealing how many points each member of staff 'scores' if they sell certain products as they aim to hit targets - and how this can result in customers not getting the 'best advice.'

At the same time, a bewildered This is Money reader who walked into a Halifax branch wanting to take out a simple two-year fixed savings account was left bamboozled when a financial adviser tried to talk her into taking out an investment product.

Commerce is based on the idea of creating products and services and then trying to sell them to customers. It's been going on for centuries.

The last time I walked into a mobile phone shop to check something on my contract, the floor staff tried to upsell me a new phone. Would I have upgraded at my own initiative? No. Did I need an upgraded phone? No. Did I want an upgraded phone? Yes, a little, once he'd finished the sales patter. Did I buy the upgrade? Yes.

My local car dealership keeps phoning to try and sell me a new car. He's not trying to sell me the most suitable car, or even trying to find out if I actually need a new car. He is simply trying to sell the new car that the manufacturer to which he is tied has just released. Again, I was not thinking about it myself, and certainly don't need a new car, and yet am strangely tempted (although I've not actually bought a new car yet).

My point is, people are trying to sell us stuff we probably don't really need all the time and their bonuses depend on it. And cars are fundamentally as complicated and dangerous as retail financial services products. (Your choice of car could contribute directly to your death, so they're much more dangerous than financial services products!)

Of course, if the salesperson is dishonest or misleading in the representations they make to the customer, we're no longer talking about 'sales' we're now talking about 'fraud'. That undoubtedly is a bad thing. Likewise, there will always be rogue traders and cowboys, just as there are in other sectors. These too should be hounded out of town.

But I think it is time we stopped demonising the very concept of 'sales' in financial services, and recognised that for a sale to take place requires both a willing seller and a willing buyer. I am not advocating no regulation and no control - quite the contrary - but I do believe that there should be greater sharing of the responsibility for outcomes between both the seller and the buyer.

The four principles of openness

In a recent TED talk, Don Tapscott talks about the four principles of openness which are sweeping across the world with tremendous consequences for institutions.

The first principle is collaboration. Essentially, the boundaries of institutions are becoming more porous.

We used to say that an organisation's people were its greatest asset. But now we say that we must look beyond the boundaries of the institution, to customers, suppliers and even more diverse communities, for the skills, capabilities and insights required to deliver innovation and performance. This has tremendous implications for security, confidentiality, etc.

As we move from social media to social production, organisations clinging to the old models and building higher walls around themselves (for example, banning social media) risk getting left behind.

The second principle is transparency. Now that almost everyone has powerful tools for finding, analyzing and publishing information, institutions are easily stripped naked. In naked institutions, values become more evident, and therefore more important, as stakeholders can easily look beyond what institutions say to what they actually do behind the scenes.

The third principle is sharing. This is the willingness to give up control. Institutions must do this not because they choose to but because they have no choice.

The music industry resisted sharing, and so customers found ways to share music without the established players. Whilst the incumbents struggled to find redress by suing their teenage target market, other companies gained control by finding new models of sharing. High-industries like pharmaceuticals are increasingly compelled to share research data and collaborate or risk their patent pipelines drying up.

The fourth principle is empowerment. If knowledge is power, then the sharing of knowledge brings the distribution of power. The arab spring is the most frequently cited example of this but I believe we will start to see this effect increasingly impact everyday life with customers taking an increasingly active and collective role in markets. We're starting to see products that capitalise on this, for example, building crowd-sourcing not just into the development process, but into the products themselves.

As we develop strategies for the future, we need to understand how these strategies will respond an thrive in this new environment. What do you think?

You can watch the original TED talk below:
 

Olympic own goal?

In my humble opinion the Olympics were a glorious success for London. Whether or not they actually made any money from event, I don't know, but the long term benefits in terms of tourism from show-casing London and British culture, combined with the motivational effect on people of all ages to get more active must be tremendous.

One potential negative side effect that I've discussed with a number of people, however, is the long-term effect of having asked so many Londoners to change their working habits during the Olympics in order to ease the burden on the transport system. Most people, of course, will already have gone back to their regular working patterns. However, there will always be a number of marginal cases, people who were already open to or even considering the idea of changing their working habits. Will this experience have tipped them over the edge? Will they never return?

Fortunately, a survey by Vodafone UK, has provided some indication of the answer to these questions. Apparently, 24% of people said they had changed their working patterns to work from home or an alternative location at least some of the time. And apparently nearly three quarters of them said they'd worked more productively as a result of the change, owing to fewer disruptions and less time spent commuting. Over half of respondents said they'd like to continue their flexible working arrangement. While 30% said their bosses already allowed this, another 23% said they thought their bosses would be more open to the idea as a result of the experience. That's a lot of percentages to mull over, but one must conclude that the Olympics will have caused a step change in working habits in and around London.

I'll leave it to you to decide for yourself, whether you think that is a good thing or not, but I can't help thinking that Boris must be wondering whether he scored an own goal this Olympics.

(Photo credit: iwillbehomesoon via photo pin cc)

Look after your existing customers first

I keep getting letters from BT telling me how wonderful their broadband service is and why I should consider signing up for it. They usually come with a generous discount for the first months.

I have two problems with this.
  1. I already have broadband from BT. So their marketing only serves to remind me of two things. Firstly that they are so disinterested in me as a client that they've forgotten I'm even there. And secondly, that I'd get a much better deal from them if I wasn't a client.
  2. I am currently seriously considering switching away from them. You see, my actual experience of their service is not as great as their marketing is trying to convince me it is.
Perhaps if BT invests more in improving the service they offer to existing customers, instead of spending all their money trying to attract new customers, I will consider staying.

photo credit: IronRodArt - Royce Bair (NightScapes on Thursdays) via photo pin cc

The Olympic spirit

We're in the grips of Olympic fever. I did my fair share of watching over the weekend both on television and live: the men's and women's road cycling races came past fairly close to our house and we turned out with most of the neighbourhood to watch. The women's race seemed particularly tough as the rain was torrential. The last cyclist came past a good distance after the second from last. I gave her as good a cheer as I'd given the first. My very young daughter asked with the innocence that only the young can muster: "Why are you cheering for her?"

Every time I see someone come last at the Olympics I am reminded of what a fantastic achievement it is just to have got to the start line. I had promised my daughter that we were going to watch "the fastest bicycle riders in the world". Even though that last cyclist was at the back of the field, she was still one of the fastest her country could put forward.

I think it is like that with business also. I've been involved in several new ventures, ranging from new product launches to complete dot.com startups. We've all seen the statistics of how many of them fail. But I've seen how much work goes into getting them to the start line. It's an Olympic effort. Yes, many new ventures fail, but if you don't put in the effort, if you don't try, if you don't put everything you've got into it, you don't even get to the start line.


The changing face of interpersonal communications

According to Ofcom's ninth annual Communications Market Report for the United Kingdom released in "Text-based communications are surpassing traditional phone calls or meeting face to face as the most frequent ways of keeping in touch for UK adults."

Other interesting findings from this report include (data is as at Q1 2012, with comparisons to Q1 2011 unless otherwise specified):

  • Total internet access has edged up to 8 in 10 homes (which is partly attributed to the rise in smartphone ownership, now at 39%).
  • Each UK household on average owns 3 different internet-enabled devices.
  • Consumption of mobile data more than doubled in the 18 months to January 2012.
  • The number of SMS and MMS messages grew to an average of 200 message per person per month.
  • The volume of voice calls on fixed line and mobiles phones fell.
  • Q1 2012 broadband take-up increased 2% in the year to 76%.  Fixed broadband take-up rose to 72% with mobile broadband decreasing to 13%. Super-fast broadband is available to 60% of UK homes at that same time. 
  • 11% of UK households own a tablet, compared to 5% of TV homes having a smart TV. 87% of tablet owners say they use it mostly at home.
  • The percentage of households taking a bundled services (combining some or all of voice, broadband and TV) has increased from 53% to 57% over the year.
The full report covers:
  • the the rise of text-based communications (pp33),
  • differences in usage between older and younger users (pp49),
  • tablets and e-readers (pp61),
  • the 2012 Olympics and Paralympics (pp75),
  • television and audio-visual content (pp113),
  • radio and audio content (pp181),internet and web-based content (pp219),
  • telecoms and networks (pp279), and
  • post (pp359).

The RDR: where to next?

I was recently fortunate enough to be invited to a lively debate about RDR (more fully, the UK Financial Services Authority's Retail Distribution Review) outcomes with a group of lawyers from a magic circle law firm. Here is a summary of our key conclusions:

The RDR will lead to better outcomes, but for fewer people.

Those (who will be mostly the less affluent) no longer pursued by financial salesmen offering some advice in return for the prospect of a product sale, and unwilling to pay for advice, will be cast adrift by the industry.

The way that marketing is done across all sectors is gradually changing with innovations such as 'big data' and 'gamification' fundamentally changing the way businesses engage with customers. In the financial services sector, behavioural finance is having an additional impact.

Sooner or later, business models will emerge which employ these new techniques to engage the consumers cast adrift by the RDR, and even compete for those still served by IFAs. There are a number of businesses that have tried (see, for example, UK direct to consumer online financial planning tools with many other examples overseas, particularly in the US) but we are not there yet.

Some of these solutions will fall within the existing regulations, some will fall without, and some will fall uncomfortably close to the edge between. It will be interesting to see how the regulator responds to this third category.

It is likely that many of these solutions will come from outside the existing established industry, and that parts of the established industry will ultimately fall away significantly in the same way that buggy whip manufacturers largely fell away in the wake of the mass production of the automobile.

What is a SWOT Analysis?

Diagram or a SWOT analysis

SWOT stands for Strengths, Weaknesses, Opportunities, and Threats.

The SWOT Analysis is almost certainly the most fundamental of all the strategy analysis tools and techniques. It is also the most widely recognised.

Many argue that it is too basic to be of much use. I would disagree.

What is SWOT analysis used for?

The SWOT Analysis can be incredibly useful as:

  • a lite or quick and dirty strategy analysis,
  • a precursor to assist in
    • planning a more comprehensive strategy analysis and
    • selecting the most appropriate more complex tools to use, or 
  • a means of collating and summarising the outputs from more sophisticated techniques.

What does SWOT analysis look like?

A SWOT Analysis is conventionally represented as a 2X2 matrix with:

  • Strengths listed in the top left quadrant,
  • Weaknesses in the top right,
  • Opportunities in the bottom left, and
  • Threats in the bottom right quadrant.

There is a logic to that presentation. I will come to that next. But at the end of the day, it boils down to 4 simple lists of strategic insights. Presentation is probably a matter of taste.

Understanding the logic of the SWOT structure

The Strengths and Weaknesses represent the internal dimension of the business unit under consideration. These cover factors which are or should be under management's control. A McKinsey 7-S analysis is a good way of making sure you've covered all your bases.

The Opportunities and Threats represent the business unit's external environment. These cover factors which are typically not under management's control. A PESTEL analysis (or one of its many variants), or Porters 5 Forces model, is a good way of going after these.

The Strengths and Opportunities represent the positive strategic forces. The Weaknesses and Threats represent the negative strategic forces.

In summary:

  • the vertical axis represents internal and external dimensions, and 
  • the horizontal axis represents positive and negative dimensions.

It is sometimes tempting to blur the boundaries between positive and negative factors, particularly in the external dimension. After all, is every Threat not really just an Opportunity not yet grasped? This may make us feel more optimistic and proactive. But I don't think it really adds anything to the analytical process. So, I advise considering simply whether the factor under consideration, if left unaddressed, would be likely to take the organisation closer to or further from its goals.

A SWOT Analysis can be an incredibly quick and insightful way to understand and communicate an organisation's current strategic positioning. It should not be overlooked simply because of its simplicity. In fact, that may be its greatest strength.

You can build a SWOT analysis, alone or with a team, using our completely new and free collaborative StratNavApp.com.

See also:

MoneyVista recognized at the MoneyFacts Awards 2012

One of my clients, MoneyVista, was recently highly commended in the innovation category at the MoneyFacts Awards 2012, coming in just behind the winner, Governor Money. I am very proud to be associated with this success.

Here is a picture of Martin Peterlechner (Marketing Director) on the left, and Karen Savva (Head of Customer Services) collecting the award.

Choosing where to offer feedback

I've just finished providing some feedback to someone from whom I had just bought something. There was nothing unusual about it - I'd bought the product, they'd asked for feedback, and I'd given a small amount of my time to offer it.

At the end of the interaction (this was all online) they said "... And thanks for the feedback - I know it takes time and effort to give it - but we really appreciate it."

Suddenly my attention was focused on the amount of time I'd taken to provide feedback. Time, of course, is a very precious commodity these days, and so we have to choose where we spend it wisely. So how do we choose when to give feedback, when to just do nothing, and when (if the service was bad rather than good) to vote with out feet.

It struck me, after a moment's reflection, that my time is better spent offering feedback to people who are already doing a good job.

People who are already doing a good job have already gone to a lot of trouble to do so. And so, it is my view, they are much more likely to receive my feedback and to go to even more trouble to use it continue to improve their product or service. Conversely, people who are already doing a bad job will probably do a bad job of addressing my feedback as well. This is a gross generalisation, but as I said, my time is precious and I've got to make a call on how I spend it.

So, if you're doing a great job, enjoin your customers to help you do it better. But if you're doing a poor job, get your house in order and sort out the basics before you try and waste even more of your customers' time.

Finally, on a purely selfish note, it struck how much more I had enjoyed giving constructive feedback about good service than I would have enjoyed explaining to some under-trained call-center operator that they were the 5th person I'd spoken to at their company today who'd been unable to help me!

(Oh, and just in case you are interested, I'd just bought the Kindle edition of "Blackboards Bubbles and Cappuccinos" from Change Designs. Watch this space for the review.)

How to tune and prune your portfolio of strategic initiatives

Once you've determined your portfolio of strategic initiatives, either as part of a new strategy you've developed, or just by listing out the initiatives currently underway within the organisation, you're in a a position to review them with a view to prioritising them and/or assessing their efficacy. The framework below provides a suitable basis for doing so. (You could, and probably should, also use a 4 Horizons analysis for this purpose.)

Diagram showing a framework for strategic initiative portfolio analysis.
By mapping your strategic initiatives out in this way your are able to evaluate your portfolio of initiatives according to three success criteria.

Firstly, have you got an even spread from low hanging fruit to strategic transformations? If you have only initiatives in the strategic transformation quadrant, you organisation is likely to stagnate during the short-term as the strategic transformation initiatives are likely to take a long time to bear fruit. Unless your organisation has very deep pockets, such a short term stagnation could place a strain on its cash flow and customers' loyalties. By including some "low hanging fruit" initiatives, you're likely to see earlier gains. This is also likely to boost staff morale and buy-in to the overall strategic change programme.

On the other hand, if you have only initiatives in the low hanging fruit quadrant, your organisation may be lured into a false sense of security, only to be toppled as significant environmental changes occur or your competitors implement step changes in their own strategies.

Secondly, are you continually challenging the innovators within your organisation to imagine the golden opportunities - those opportunities that produce disproportionately high benefits relative to their costs, risks and difficulty of implementation? By continually challenging your organisation to do so, your will hopefully move your portfolio upwards and leftwards on the grid over time.

Thirdly, are you successfully avoiding projects with a low cost-benefit ratio? These tend to be the pet projects of key decision makers and/or resource allocators - although they are sub-optimal relative to the rest of the portfolio they are pursued on irrational grounds based on personal agendas. These should be eliminated. This may need to be done carefully so that the people with vested interests in these initiatives do not become alienated from the rest of the strategic change programme. However, it is important that this entire analysis is done on the basis of sunk costs - that is sunk costs should be ignored from the costs side of the analysis. A project that started out as a pet project but which has already spent 90% of its costs may now be low hanging fruit if you believe all of the benefit are still attainable for the cost of only 10% of the initial costs. Clearly you can't get the 90% of costs already spent back, but you should consider them a valuable lesson in the importance of avoiding these kind of projects in the future.

As you get ready to kick off your strategic planning process for the year, this may be a great opportunity to evaluate your existing portfolio of strategic initiatives with a view to pruning it and developing it forwards. Please let me know how you get on in the comments below.

Alternating between divergent and convergent processes

A strategic process alternates between divergent and convergent processes.

Divergent processes are about harnessing diverse opinions and perspectives to generate new options, alternative, scenarios and insights. In divergent thinking, within limits, more and more different is better. Convergent processes, on the other hand, are about evaluating, prioritising, making choices, and ultimately aiming for one single and clearly defined answer.

Diagram showing convergent and divergent steps

Too little divergence results in bland, undifferentiated, ‘me-too’, magnolia strategies. Too little convergence results in lack of focus and alignment, and ultimately in failed execution.

When you are constructing your strategic planning process, it is important to understand which parts of the process are divergent and which are convergent. You can do this at the micro level or at the macro level. For example, you could pursue some months of divergent thinking followed by some months of convergent thinking, or you could facilitate divergent thinking in the first have of a meeting and convergent thinking in the second half of the same meeting. Part of the process facilitator's role is to know which process to apply when, and to manage the transition from one mode to the other. It can be incredibly frustrating for everyone involved if some people are being divergent while other people are simultaneously being convergent. It is also worth considering that some people are better at divergent thinking, whilst others are better at convergent thinking - at the risk of stereotyping, we might think of these as creatives or implementers.

See also:

Optimizely brings A/B testing into the mainstream

As I've mentioned before, one of the keys to success in an increasingly competitive world is having the right data - and lots of it (see More data usually beats better algorithms). Businesses (and politicians) are increasingly looking beyond traditional research (with all its pitfalls) to real behaviour. And as more and more customer interactions move online, the possibilities for collecting real behavioural data are expanding rapidly.

One method of collecting real behavioural data is "A/B testing". Simply put, A/B testing works as follows:

  1. creating multiple versions or variations of pages on your web site with subtle differences in design or messaging,
  2. serve the multiple versions concurrently to different users at random for period of time, (typically, in a mature site, only a statistically significant percentage of users would see the variations under consideration with the vast majority still seeing the tried and tested pages)
  3. track the results in terms of which versions or variations produce higher levels of the desired behaviour,
  4. discard the versions that provide lower levels of desired behaviour and keep the versions or variations that provide higher levels,
  5. and finally, repeat the process as often as you like (apparently Google ran some 7,000. A/B tests in 2011).

The variations could be simple design changes: are users more likely to click on a button when it is red or when it is green? Does increasing the size of the button,or bolding a key word increase the number of clicks? However, more substantial variations are possible, ranging from different copy to different combinations of products and features.

Although the origins of A/B testing can be traced back to Google as far back as 2000, it really only began to capture people's imagination when US President Obama began to use it in his 2008 election campaign.

Unfortunately, A/B testing has historically been difficult to implement. That is, until Dan Siroker, the ex-Googler who introduced Obama's campaign team to A/B testing, teamed up with another ex-Googler, Pete Koomen, to launch Optimizely. With it's intuitive graphical user interface, Optimizely allows non-technical users to develop A/B testing campaigns.

As A/B testing goes mainstream, I am sure we can expect more tools in the market. One things is for sure:- the world of online marketing and web development has changed significantly and forever.

Your brain could be your password

One of the obstacles to online engagement is the number of passwords your customers have to remember.

Using popular sites such as Facebook or Google to provide authentication services is one way to avoid forcing your users to create yet another login and password. However, science is looking for even better solutions: this video from Mashable describes a number of alternatives, the most notable being the use of the unique patterns of brain waves each of us has.


This has obvious advantages over fingerprint and retina scanning, as I am sure we've all seen films where the villains remove someone's finger or eyeball to gain access!

How to build executive alignment around strategic change

If you're struggling to get your strategic initiatives out of the starting blocks, it may be because your executive decision makers are not aligned around the strategic imperative(s) for change. If they're not conscious of what the real problem is, their underlying discomfort may cause them to pick holes in your strategic initiatives' business cases and plans instead. You'll know that this is happening when no amount of addressing their concerns by further research or additional planning satisfies their concerns about your initiatives - they just keep picking on new perceived problems.

When that happens, it is time to take a step back and:
  1. Highlight the similarities and explore the differences in their understandings of the strategic imperative(s) for change.
  2. Evaluate, prioritise and/or otherwise adjust the strategic initiatives on the basis of the understanding achieved in step 1.
Step 1

You can identify the similarities and differences in understanding of the strategic imperative(s) using a simple matrix. You can do this conceptually, or by actually drawing a matrix that looks like this:

Stakeholder 1
Stakeholder 2
Stakeholder 3
Stakeholder 4
etc.
Strategic imperative 1
Strategic imperative 2
Strategic imperative 3
etc.

You can do this exercise by interviewing all of your executive stakeholders individually, or by getting them all together and doing it as a workshop, depending on the team culture and how well it works together. It is important to try to put real colour to your strategic imperative(s) avoiding generic but unhelpful imperatives like "growth" or "cost-cutting" and getting into details such as "what kind of growth?", "how?", "where?" and especially "why?".

Once you've identified the differences in understanding of the strategic imperative(s) for change you can start to explore them. Some differences are knowable. That is, they are differences of 'fact', and once the true facts are established the differences of opinion go away (assuming it is done in a way which build consensus, rather than in a way which just 'scores points'). Knowable differences usually lead to further research to establish the facts.

Other differences are unknowable. These are typically opinions about things that have not yet happened and can't be accurately predicted. Where you encounter these, it is useful to construct scenarios which increase the level of understanding of what the possible outcomes might be, to build strategies which are robust across multiple outcomes, and to put systems in place to monitor or even influence the situation as it unfolds.

Step 2

Once you've achieved some measure of alignment, you can re-evaluate, prioritise and otherwise adjust your strategic initiatives. Again, a simple matrix may help, such as the one outlined below:

Initiative 1
Initiative 2
Initiative 3
Initiative 4
Initiative n
Strategic imperative 1
Strategic imperative 2
  • Scenario a
  • Scenario b
Strategic imperative 3
Strategic imperative ...
Financial attractiveness
(Organisational) ability to execute
Overall ranking

Note that in addition to the strategic imperatives and scenarios, you'd still also evaluate the initiatives against their financial attractiveness and the organisations ability to deliver them.

A simple High / Medium / Low ranking is probably enough for this purpose.

At this point if you've not yet achieved some measure of consensus around your strategic initiatives, you will have a pretty good idea of why not. At that juncture, you can turn the conversation around: if your stakeholders don't believe your initiatives will address the strategic imperative(s), then what kind of initiatives do they believe will? This turns the conversation for a negative criticism into a positive co-creation exercise.

What have been your experiences of building consensus around strategic initiatives? I'd love to hear about them in the comments below.