StratNavApp.com banner ad

How to design a Target Operating Model (TOM)

Once you've articulated your strategy, one of the next things to do is to design the organisation to deliver it. This is usually expressed in the form of a Target Operating Model (TOM). A TOM may be for a new organisation you're going to set up, or it may describe the end state for a change programme for an existing organisation.

Triangle show components of the TOM

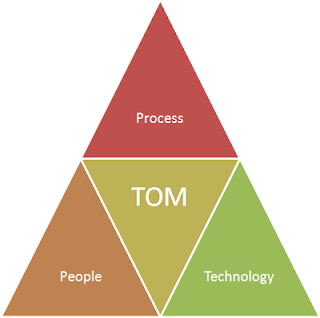
The general approach is to define the people, processes and technology required to deliver the strategy.

Process

The most common approach for identifying an organisation's processes for creating value is to use Value Chain methodology popularised by Michael Porter. This allows you to identify both

  • the core processes, such as manufacturing, sales and distribution, and
  • the supporting functions, such finance, IT and HR.

Both types of processes may be essential to the delivery of your strategy.

For each process, it is important to understand

  1. what the critical success factors (KSFs) and key performance indicators (KPIs) are. That is, what does 'good' look like in the performance of the process.
  2. what the inputs are and who provides them.
  3. what the outputs are and who receives or consumes them.
  4. the type of process: for example, you can classify processes as
    • unit or job processes: units of work are processed one at a time from start to finish, like building houses or tailoring suits.
    • batch processes: a defined number of units are processed together, like off-the-rack clothing, 
    • mass production processes: units of work move in sequence through stages, like assembling automobiles, or 
    • continuous processes: output is continuous, like paper milling.
  5. anticipated volume and frequency of performance, and drivers of both.
  6. whether and how the process is required to be performed in a differentiated manner in order to deliver strategic value.

Once you've identified and defined your processes, it should follow naturally what people and technology the processes will need.

People

For each process, identify:

  • the roles, 
  • numbers of people in each role, and 
  • skills, capabilities and knowledge required by each role.

Consider also whether you will need to:

  • hire in new or additional people, 
  • provide more training to existing people, or 
  • partner with organisations who already have the types of people you need.

You're then in a position to consider:

  • reporting lines,
  • organisational design,
  • governance and 
  • rewards (including compensation and benefits).

Don't forget to think about where the people are or will be physically located, and what implications that might have for your organisation.

Finally, consider the impact of organisational values and culture.

See also:

Technology

Technology and systems enable the people to perform the processes.

These include computer systems, manual systems, manufacturing systems and any other supporting technologies.

Do these systems and technologies exist or can you buy, license or rent them? Can you use 'off-the-shelf' systems, or will you have to develop bespoke solutions especially for your business? The more differentiated your processes are the more likely it is that you will need bespoke solutions, or that pre-existing solutions will need extensive customisation.

How will you integrate and maintain these systems? You should be able to map this back to your process view.

Extended approaches

There are a number of different ways in which you could extend this general people-process-technology approach.

Firstly, you could go beyond the convention of considering just people and technology. For example, you could consider all 7 dimensions encapsulated in the McKinsey 7S analysis. People or Staff and technology or Systems are two of the 7 Ses. McKinsey 7S does not emphasise the process dimension.

Secondly, you could adopt the POLISM model developed by Andrew Campbell, and others, at Ashridge Business School. POLISM stands for Process (or value chain), Organisation, Locations, Information Structure and Management system. This gives more prominence to location and suppliers. It considers information and management systems more explicitly than it does technology.

Andrew then went on to propose an integration of the POLISM model and the Business Model Canvas. I have previously written about this in Introducing the Enhanced Business Model Canvas.

The Target Operating Model's role in business strategy execution

Your strategy implementation plan needs to consider all of the implications of the above:

  • designing processes,
  • hiring, training and motivating staff,
  • acquiring or building up knowledge, and
  • selecting, implementing, customising, building and/or integrating systems.

Designing a TOM is a significant piece of work. But, the real challenge lies in developing and implementing a TOM which actually

  1. delivers your strategy and
  2. differentiates your organisation from the competition.

StratNavApp.com is the online collaborative tool for strategy development and execution. It integrates all of the tools mentioned above: Porter's Value Chain, including Process, People and Technology,  McKinsey 7S, and the Enhanced Business Model Canvas. So it can help you develop your Target Operating Model. It is free to use, so go ahead and give it a try.

Skyfall moments in business

There is a moment in the new James Bond film, Skyfall, when 007 realises that he is the victim of someone else's plan. Its an uncomfortable feeling for him, as he feels he is always trying to catch up and never in control.

Many firms find themselves in a similar position, where markets become dictated by larger competitors, suppliers, customer and regulators. It is what you do in such circumstances which makes all the differences. Many first simply redouble their efforts to catch up and get ahead of the competition. Most find that this is an expensive exercise by no means guaranteed to succeed.

James Bond did not do that. Instead, he withdrew from the field, fell back on his own strengths and sought out competitive environment he knew better than anyone else. Then he forced the competition to come to him, in his territory, and on his terms.

And that is the secret to success. Whether you call it competitive differentiation, relative competitive advantage, or Blue Ocean Strategy, companies that succeed do so by relying on their own strengths and picking their own competitive arenas, and not by competing on other people's terms.

Analyse the business and its environment

The world is full of strategy analysis tools, models and frameworks, many of which  are very useful for getting to grips with  the strategic challenges the organisation faces. See 7 essential strategy analysis tools for examples of some of the most popular and useful ones.

However, it is important to remember that all of these models are a means to an end, and not an end in themselves. The 'end' is to generate strategic insight which is useful in generating successful strategy. The strategy analysis frameworks and models may help you to do this, but strategic insights generated without the aid of such frameworks and models can be just as good as those generated with them.

Analysis generally requires data as an input. In strategy, data usually arrives from one of four sources:

  1. data which is generated within your business, such as operational performance data.
  2. data which is generated in the interaction of your business with the outside world, such as from customer or supplier transactions.
  3. data which is generated by primary research, such as customer surveys and focus groups you conduct.
  4. data originating from secondary research, such as industry wide reports.

Whatever the source of the data, the basic process of analysis is the same.

  1. First the data is studied to see if there are any trends: for example 10 daily sales volumes, each higher than the preceding one, shows an increasing trend in sales data
  2. Then the trends are studied to see if they yield any patterns: for example, sales always increase when the weather gets warmer.
  3. Then we attempt to deduce the structures supporting those patterns: customers buy more ice-cream when it is warmer.
  4. And finally we attempt to derive theories explaining what we see: customer buy ice-cream when they are hot because it cools them down.

It is those theories that drive insight. (For example, if we can sell both ice-cream and hot chocolate, our stores will be busy whether the weather is hot or cold. Or, ice-creams compete with soft drinks, not just with other ice-creams.)

As humans we are conditioned to this process and do it so naturally that we don't always notice we're doing it. Unfortunately, we are also fallible and can jump to conclusions without properly considering all of the data. The 'scientific method' is useful in this context. By actively seeking out to disprove our theories, we increase our confidence that the ones we can't disprove may actually be correct.

Analysis is an art as much as it is a science. Some people seem to have a knack for looking at data in different ways which more effectively unlock its secrets.

There are also people who think intuition trumps analysis. They argue that analysis is cold and clinical and doesn't always take into account the whole picture and the subtle clues. I am less convinced. I think that intuition is a form of analysis - its just analysis of the experience data that resides in our brains rather than coded on spreadsheets and in databases.

Big data is having a profound effect on the art of strategic analysis. With more and more data about wider and wider ranges and types of human behaviours increasingly available in computer systems, our ability to derive strategic insight from coded data is better than ever before. See, for example, More data usually beats better algorithms. Of course, the availability of this data increases rather than reduces the burden of analysing it for insight.

Control Processes in the Strategic Learning Cycle

Once you've articulated your strategic vision, objectives and values, and crafted your implementation plan of action, the fourth phase in the Strategic Learning Cycle is to control your execution.

The strategic control framework usually consists of 4 components:
  • Measurement: the first level of control is to measure whether you are achieving your strategic objectives - see How to measure success against strategic vision and objectives . Measurement also provides the data on which the other 3 components depend.
  • Risks and Issues Management: your measurement system should help you to monitor the risks to your strategy and identify any issues as early as is possible.
  • Feedback: identified issues provide feedback. The Strategic Learning Cycle provides 2 feedback loops. The first loop returns to planning and implementation - plans are adjusted and efforts are redoubled, but the strategy itself remains unchanged. The second feedback loop returns to analysis - if the conditions on which the original analysis was based are found to not have been true or to have changed, then reworking the analysis may lead you to change the strategy itself.
  • Governance: finally it is important to have a good governance framework in place. This ensures that the right information reaches the right people at the right time, and empowers those people to use it to make decisions in a suitably transparent manner. (By contrast, poor governance suppresses or obscures information and allows decisions to be made based on special interests.)